 Gloria Glover
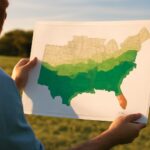
 Climate classification groups places by long-term patterns of temperature and precipitation, not by one storm or season. On a map, labels show recurring conditions: how warm a location is, how much rain or snow it receives, and when that moisture usually arrives.
We can read a U.S. map as a broad pattern guide. Its boundaries connect geography with climate, but they do not predict next week’s weather. Local conditions vary within one region, especially near coasts, deserts, and mountains.
How climate classification works
Climate classification uses long-term measurements, commonly 30-year averages called climate normals, plus thresholds for temperature, precipitation, and seasonal moisture. Categories may depend on warmest and coldest monthly temperatures, annual precipitation, or whether rain falls mainly in summer or winter.
The Köppen system, common on U.S. maps, uses broad groups such as tropical, dry, temperate, continental, and polar. Other systems combine or rename them as humid subtropical, semi-arid, Mediterranean, or highland. The legend matters because the same place can receive different labels under different rules.
How to read the climate map of the US
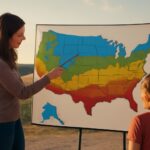
Start with the legend, then locate latitude, major water bodies, and elevation. A humid label usually indicates plentiful moisture; a dry label indicates limited precipitation or a strong seasonal imbalance. Check whether colors represent annual conditions, seasonal patterns, or both.
Read each boundary as a transition rather than a sharp wall. This matters across the Great Plains, Appalachian foothills, and mountain valleys. Use a map for regional comparison and local station data for a specific town. It is a climate reference, not a short-term weather forecast.
Major regions on a climate map of the United States
Most maps show several overlapping ideas rather than one uniform national climate zone.
Humid East and continental interior: Gulf Coast to Great Lakes
The humid East runs from the Gulf Coast through the Southeast and Atlantic coast. Summers are generally warm, and precipitation arrives in many seasons. The Great Lakes and New England have colder winters. Across the Great Plains and Midwest, annual temperature ranges grow larger, while rainfall often decreases westward.
Dry West: Great Basin and Southwest
The Great Basin and Southwest are dry because of distance from ocean moisture and repeated mountain rain shadows. The region includes hot low-elevation deserts near Arizona and southern California, plus cooler high-desert and semi-arid areas where elevation changes the pattern.
Mediterranean and marine West: California and Pacific Northwest
California’s Mediterranean climate typically has dry summers and wetter winters. The Pacific Northwest is cooler and generally wetter, with marine influence moderating temperatures near the coast. Moving inland reduces that ocean effect and increases seasonal extremes.
Tropical, subtropical, polar, and highland areas: Florida, Hawaii, Alaska, and the Rockies
Southern Florida and Hawaii contain tropical or subtropical areas, depending on the map’s thresholds. Alaska includes polar and subpolar climates, while the Rockies and other high ranges are often marked highland because elevation creates conditions unlike surrounding lowlands.
Why the West has sharp climate changes
The West changes quickly because several controls operate over short distances. Pacific air moderates coastal California and Washington, but the Sierra Nevada and Cascades force rising air to drop moisture on their western slopes. Behind them, rain shadows produce dry basins. Farther east, elevation, slope direction, and distance from the Pacific create sharp shifts between valleys, plateaus, and alpine peaks.
Why map systems draw different boundaries
Map systems draw different boundaries because they use different data, periods, thresholds, and scales. One may emphasize temperature, another precipitation or vegetation. A boundary may follow a calculated contour rather than a county or state line. When comparing maps, read each legend and method first; disagreement often reflects different definitions, not error.