 Gloria Glover
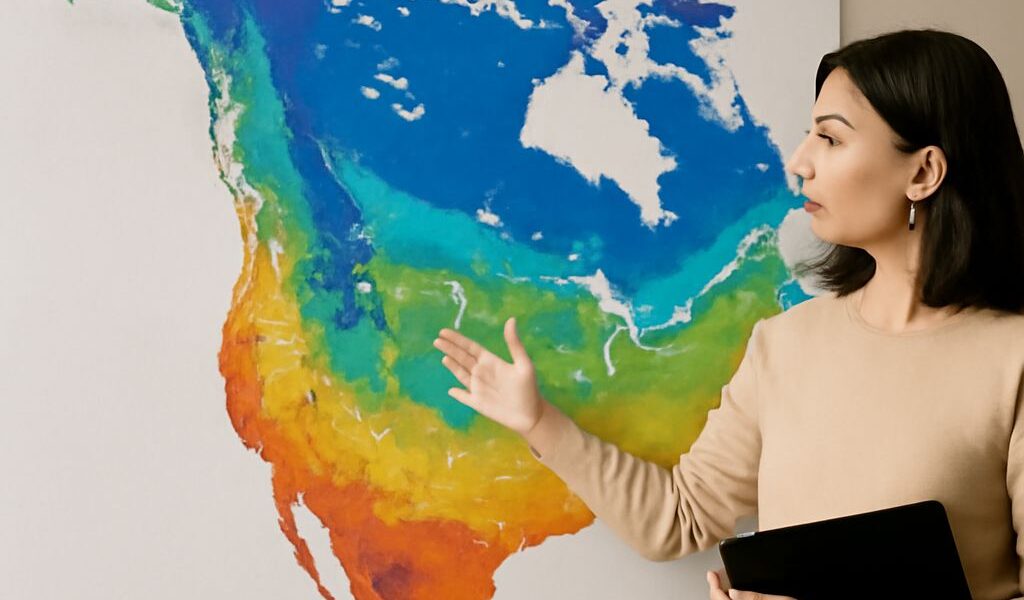
 A United States climate map shows broad areas with similar long-term temperature and precipitation patterns. To read it well, we first check the legend, then compare each area’s typical heat, cold, wetness, and dryness. These zones describe geographic patterns, not exact political borders.
We can use the same approach on a North America climate map: identify the controlling physical factors, locate the main pattern, and then note local exceptions caused by elevation, coastlines, and terrain.
How to Read a United States climate map
Start with the map’s classification system and color key. Some maps emphasize average temperature, while others combine temperature with seasonal precipitation. Then ask three questions:
- What controls the pattern? Latitude, ocean influence, elevation, and mountain barriers are the main clues.
- How broad is the zone? A color may represent a large regional tendency rather than identical weather everywhere within it.
- Where are the transitions? Gradual changes often occur across plains, foothills, and coastal areas.
What a climate region represents
A climate region is an area whose long-term temperature and precipitation have similar patterns. Climate describes averages and seasonal behavior over many years; it does not predict the weather on a particular day. For example, a dry region may still experience a major storm, and a normally cool region may have a brief heat wave.
Maps group places to make these patterns easier to compare. A region can be defined by annual averages, seasonal rainfall, temperature ranges, or a combination of measures. Because mapping systems use different criteria, the same location may receive slightly different labels on different maps.
Major patterns on a North America climate map
North America’s largest climate patterns follow latitude and the distribution of land, water, and mountains:
- Arctic and subarctic north: Northern Canada and Alaska have long, cold winters and short, cool summers.
- Marine west coast: Coastal British Columbia, the Pacific Northwest, and southern Alaska receive strong ocean moderation and generally wetter conditions.
- Dry western interior: The Sierra Nevada, Cascades, and Rocky Mountains block moist air, leaving deserts, plateaus, and semiarid basins farther inland.
- Humid east: Moisture from the Atlantic, Gulf of Mexico, and Great Lakes supports wetter conditions across much of eastern Canada and the United States.
- Tropical and subtropical south: Mexico, southern Florida, and parts of the Caribbean have warmer temperatures, with rainfall shaped by seasons, storms, and elevation.
Mountain ranges create sharp contrasts over short distances. Windward slopes can be cool and wet, while leeward valleys are warmer and much drier. The Great Plains also form a transition zone between the humid east and arid west.
Climate regions of the United States—and why map boundaries differ
For a region-by-region orientation, we can read the United States as a set of overlapping broad patterns:
- Alaska: Arctic and subarctic conditions dominate the north, while coastal areas are milder and wetter.
- Pacific Coast: Washington and Oregon are strongly ocean-influenced; coastal and inland California range from marine to Mediterranean and semiarid.
- Mountain West: The Rockies and other ranges produce cool highlands, snowy slopes, dry basins, and sharp elevation-based changes.
- Southwest: Arizona, Nevada, New Mexico, and west Texas are mainly arid or semiarid, although high elevations are cooler.
- Great Plains and Midwest: Conditions become more continental, with larger seasonal temperature swings and a west-to-east increase in moisture.
- Northeast and Southeast: The Northeast is generally humid continental or marine-influenced; the Southeast is warmer and humid subtropical, with tropical conditions in parts of southern Florida.
- Hawaii: Tropical conditions vary by elevation, wind exposure, and the rain-shadow effects of volcanic mountains.
Boundaries and labels differ because climate does not change at state lines. One map may divide regions by temperature thresholds, another by rainfall or vegetation, and a third by seasonal patterns. We should therefore use labels as guides, read the legend, and expect blended transition zones near coasts, mountains, and major plains.